Meta Conversions API Gateway Reporting Guide
Introduction
This guide will help you navigate through the reporting features available, enabling you to analyse your data and make effective decisions.
Key Reporting Metrics
The Meta Conversions API Gateway Reporting focuses on three critical metrics:
- Total Incoming Signals:
- Definition: The total number of events received by the gateway.
- Importance: Indicates the volume of data you’re collecting and attempting to send.
- Total Outgoing Signals:
- Definition: The number of events successfully transmitted to Meta.
- Importance: Reflects the efficiency of your data transmission process.
- EMQ Score (Event Match Quality):
- Definition: Event match quality indicates how effective the customer information parameters sent with your server event may be at matching events to Meta accounts.
- Importance: Higher scores generally lead to better ad targeting and performance.
Accessing the Reporting Interface
Once the Meta Conversions API Gateway setup has been completed, the user can access the reporting by clicking on the Signal count icon as shown in the image.
Reporting Components
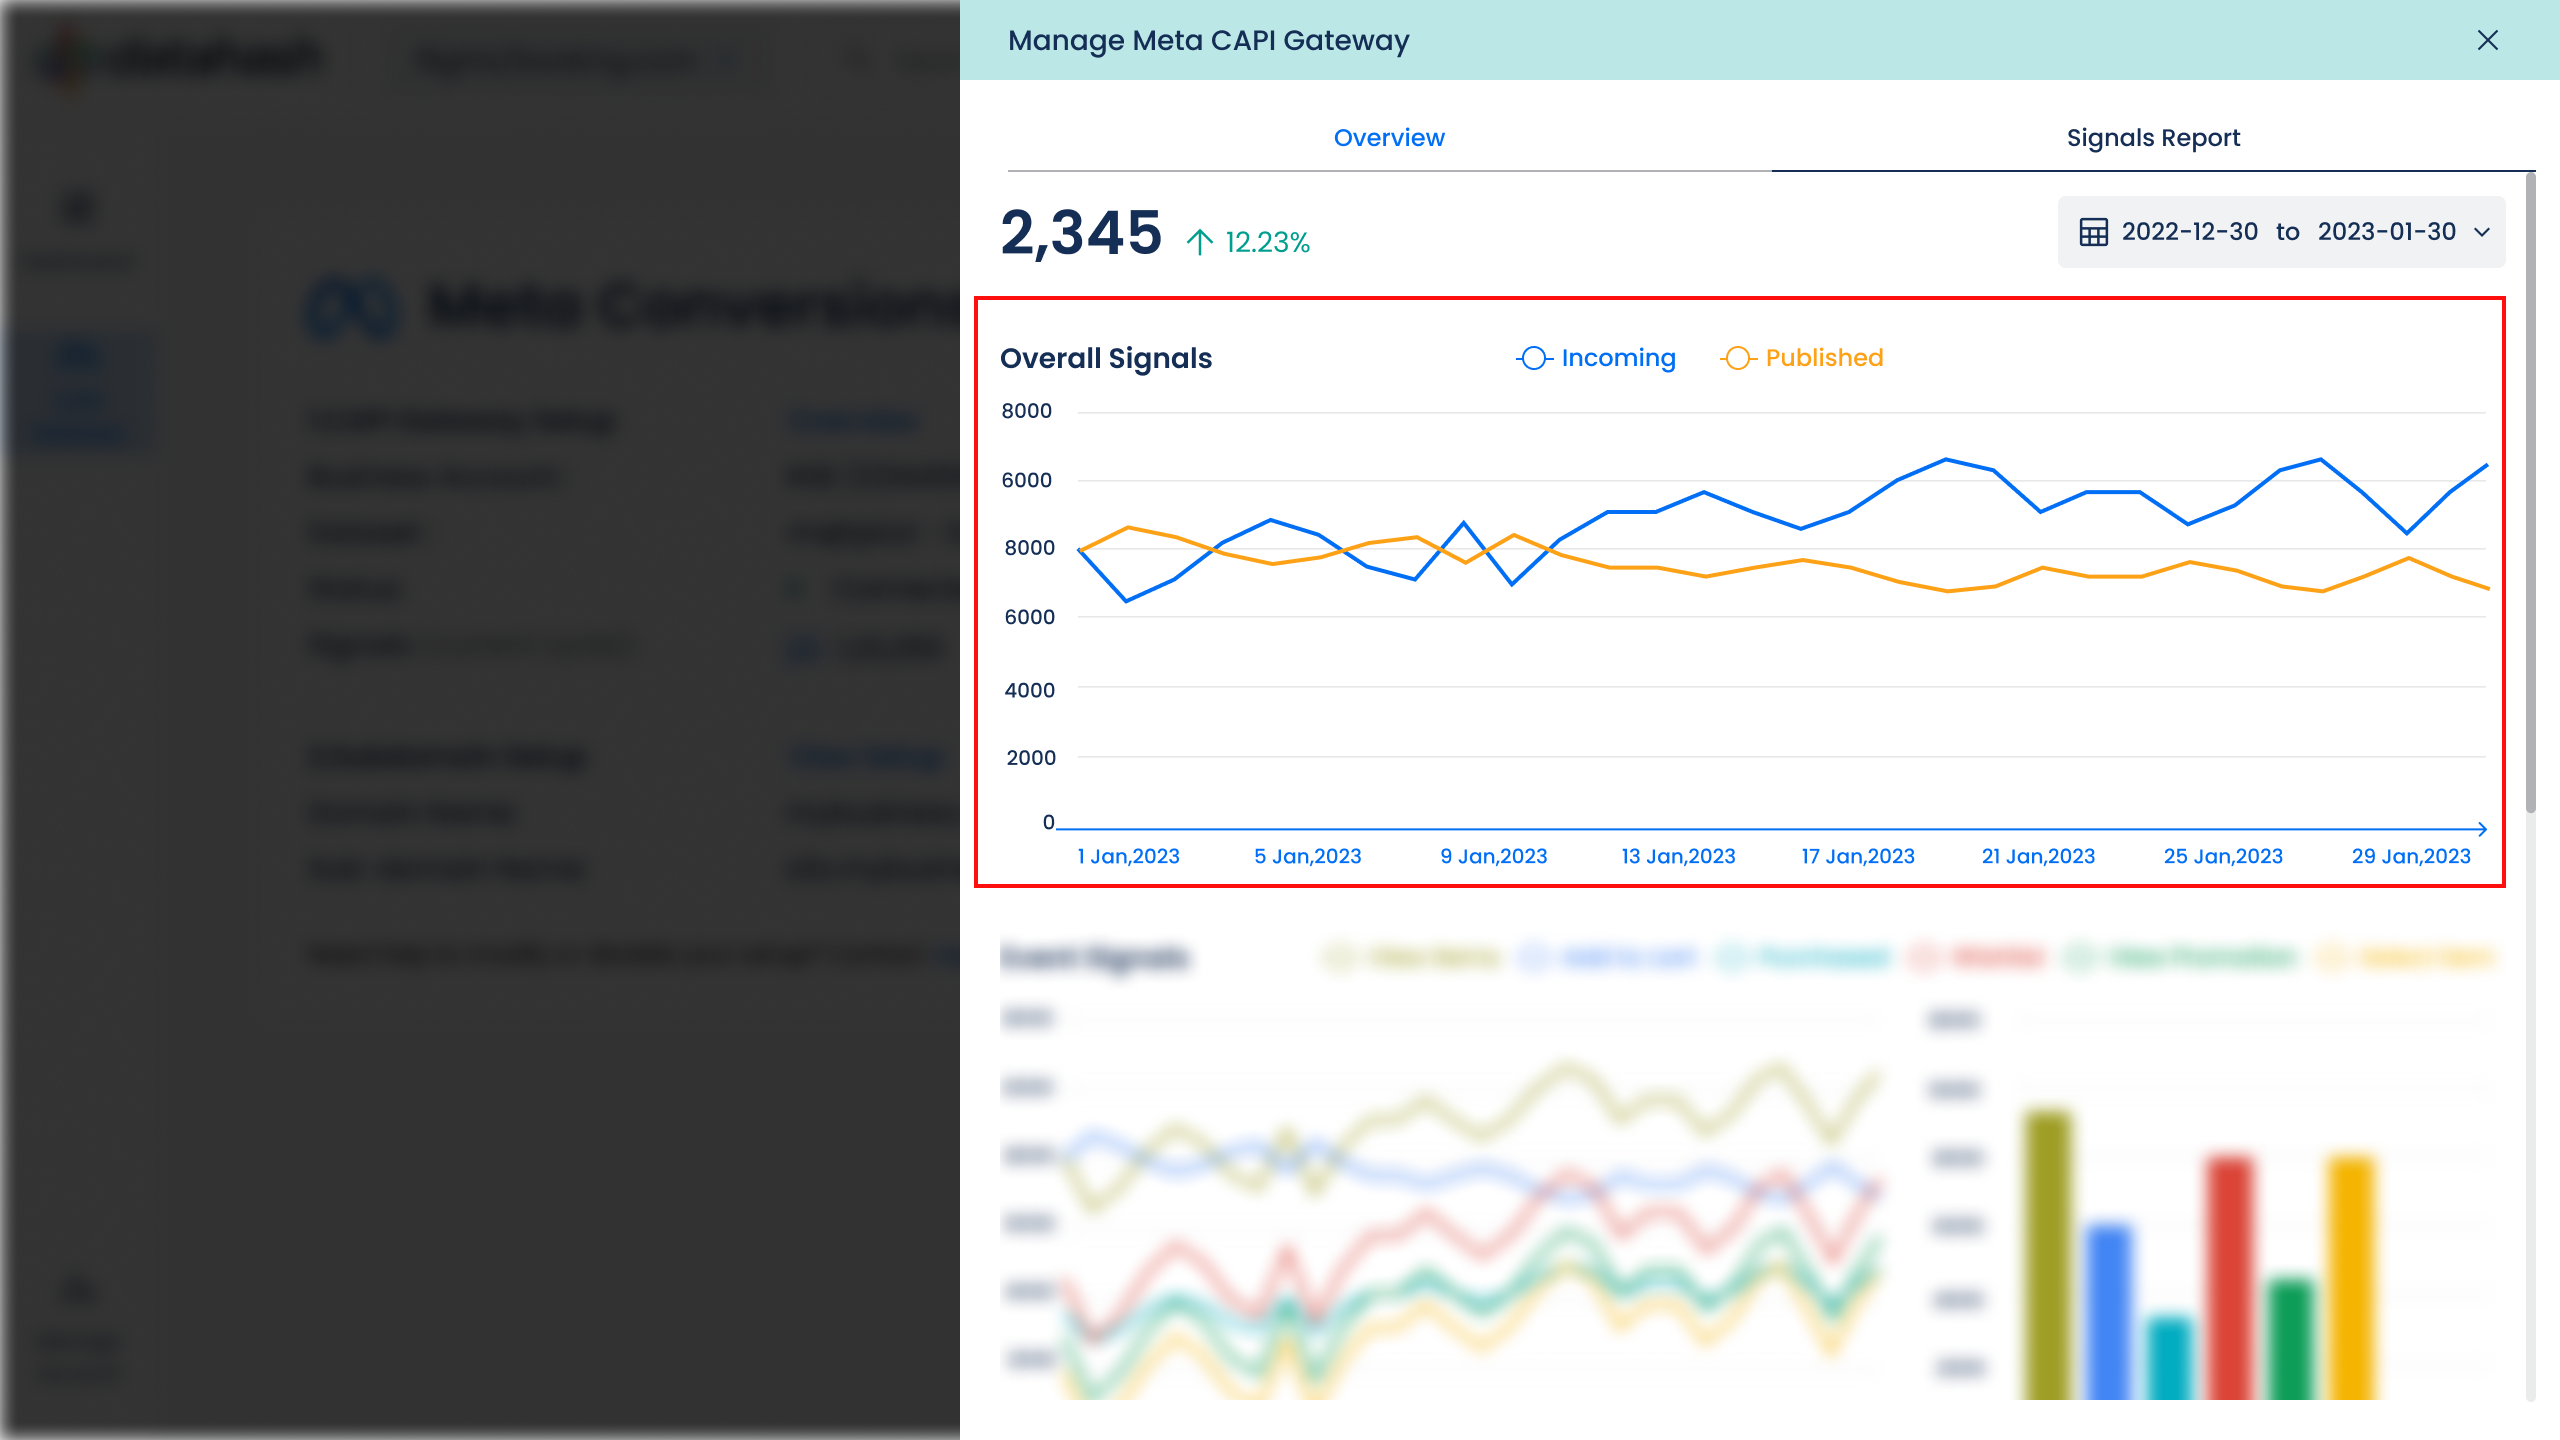
Event Volume Overview
This main graph displays your event volume over time.
Key features:
- Adjustable time range (e.g., last 7 days, last 30 days, custom range)
- Total event count (incoming and outgoing signals) for the selected period
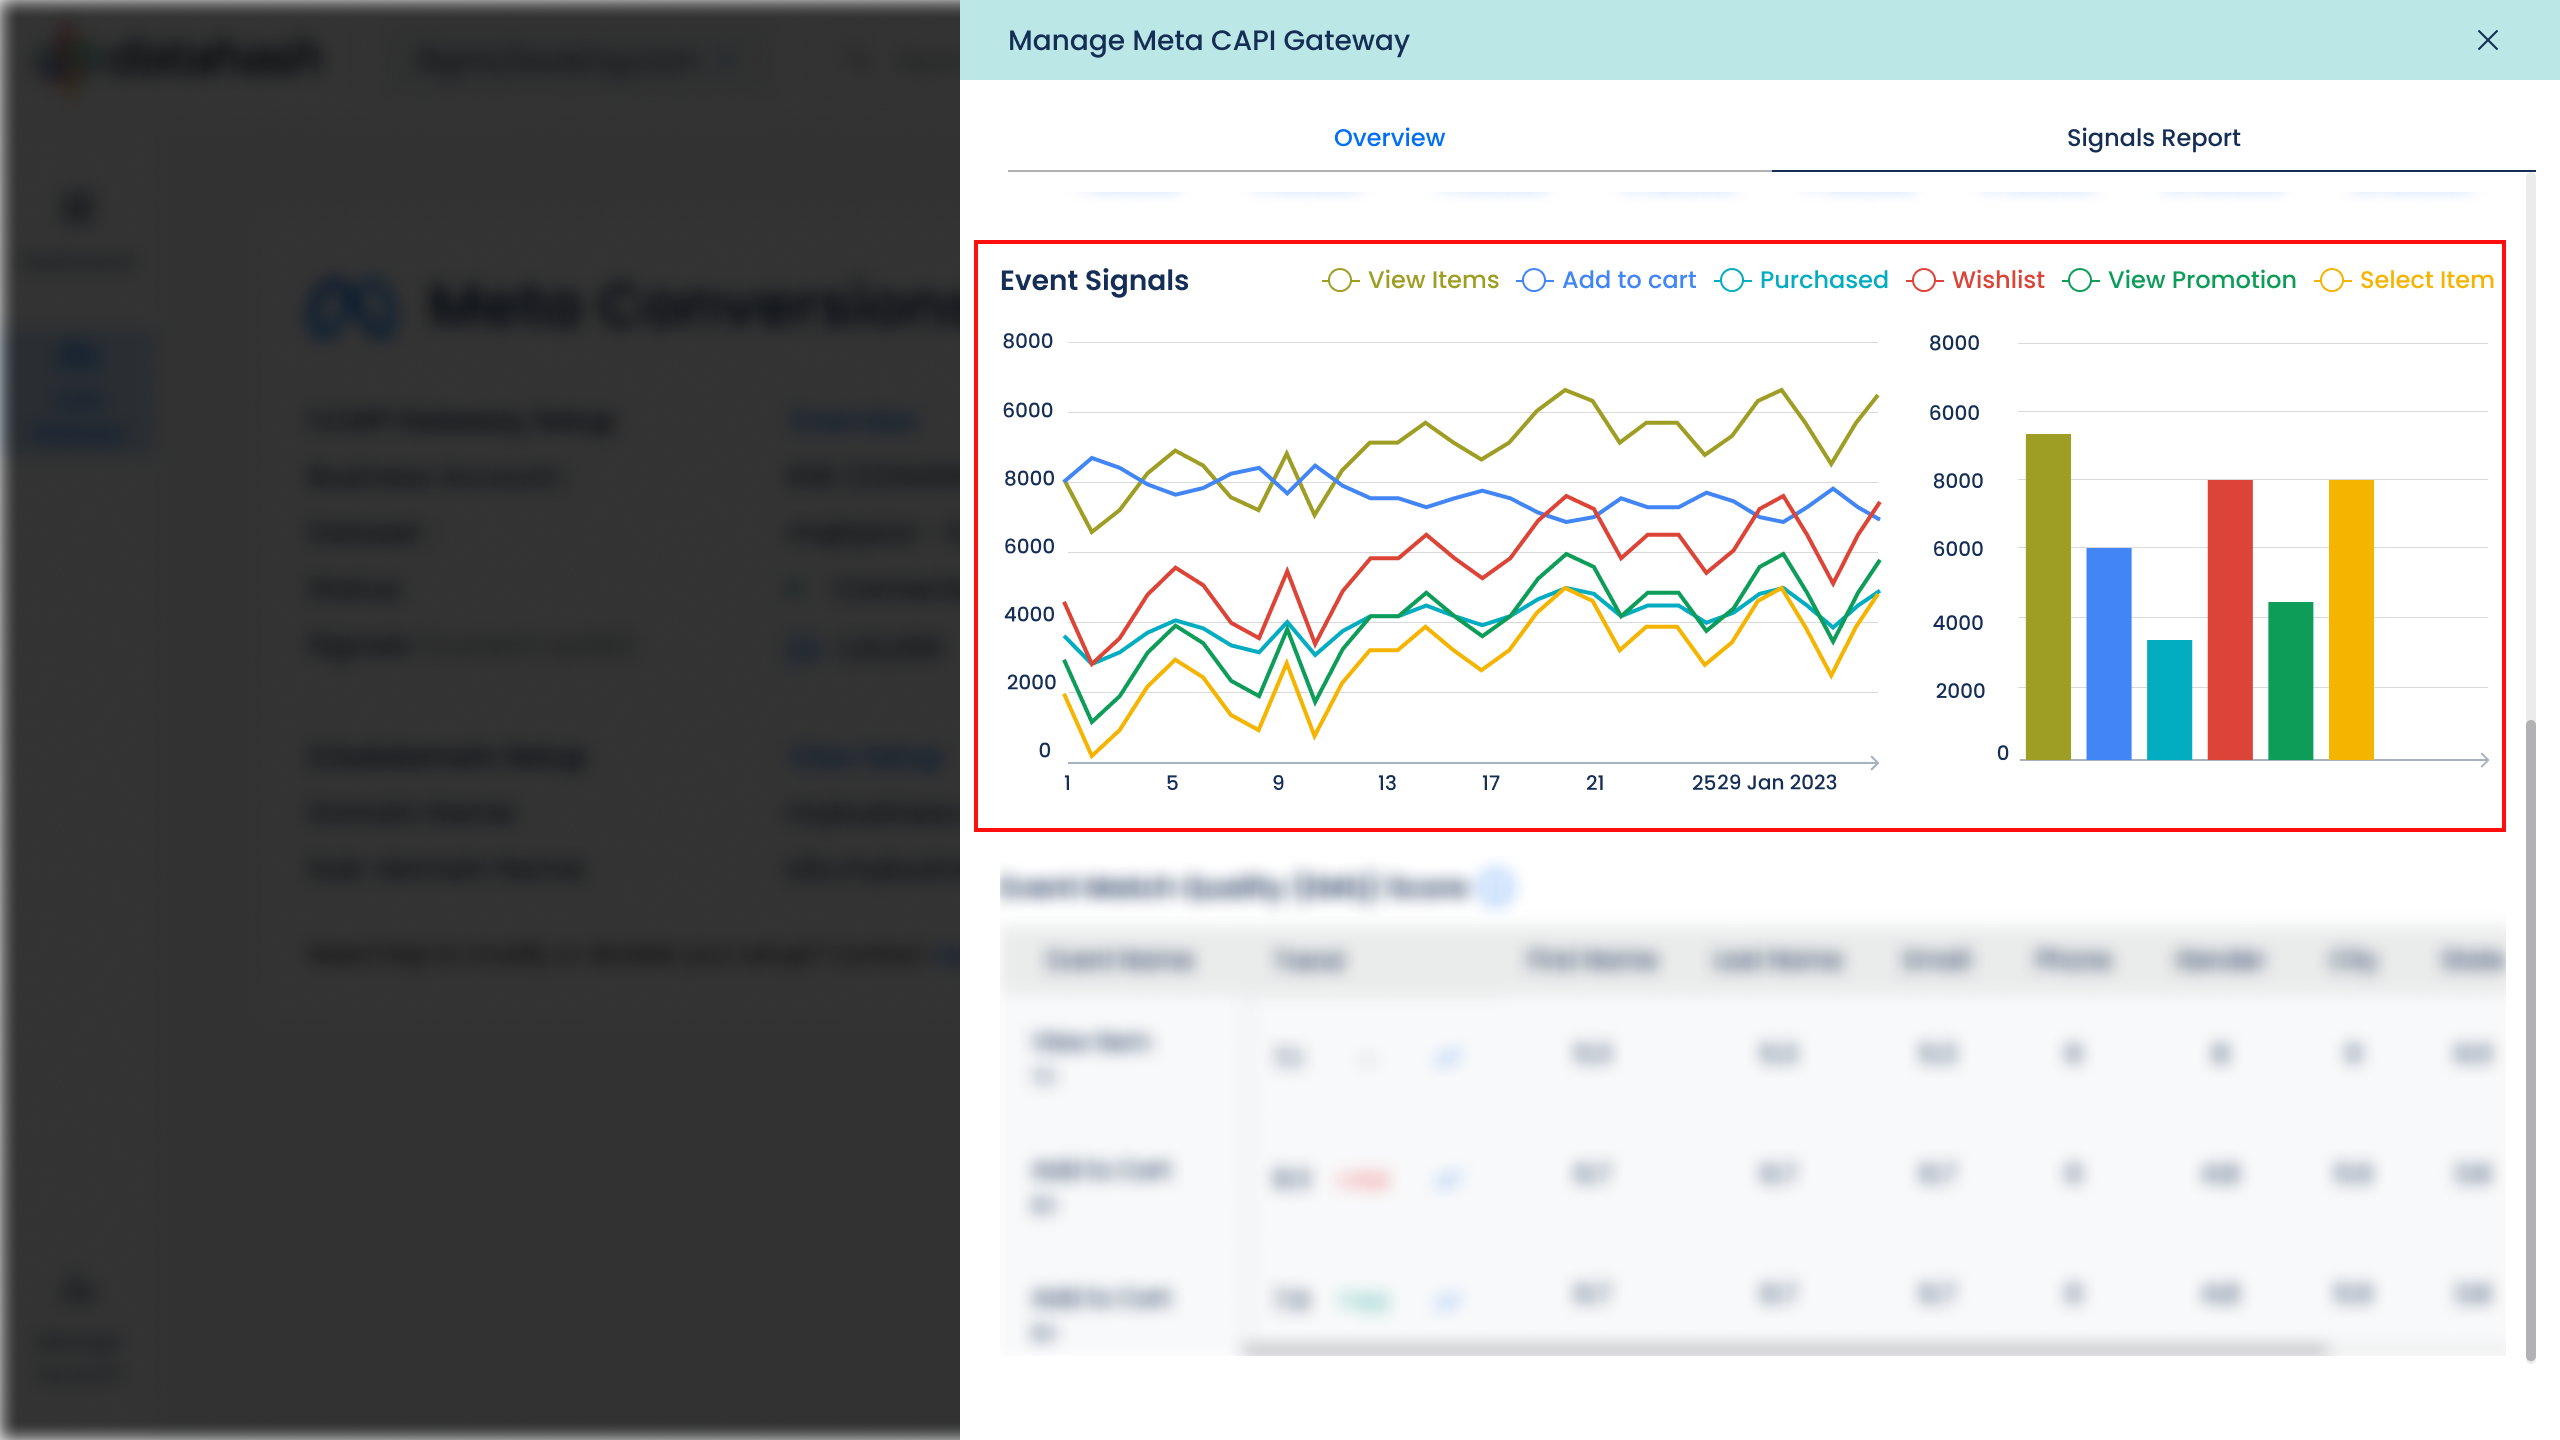
Event-Level Breakdown
This section provides a detailed view of individual events.
Key features:
- Bar chart showing volume by event type
- Ability to filter or highlight specific events
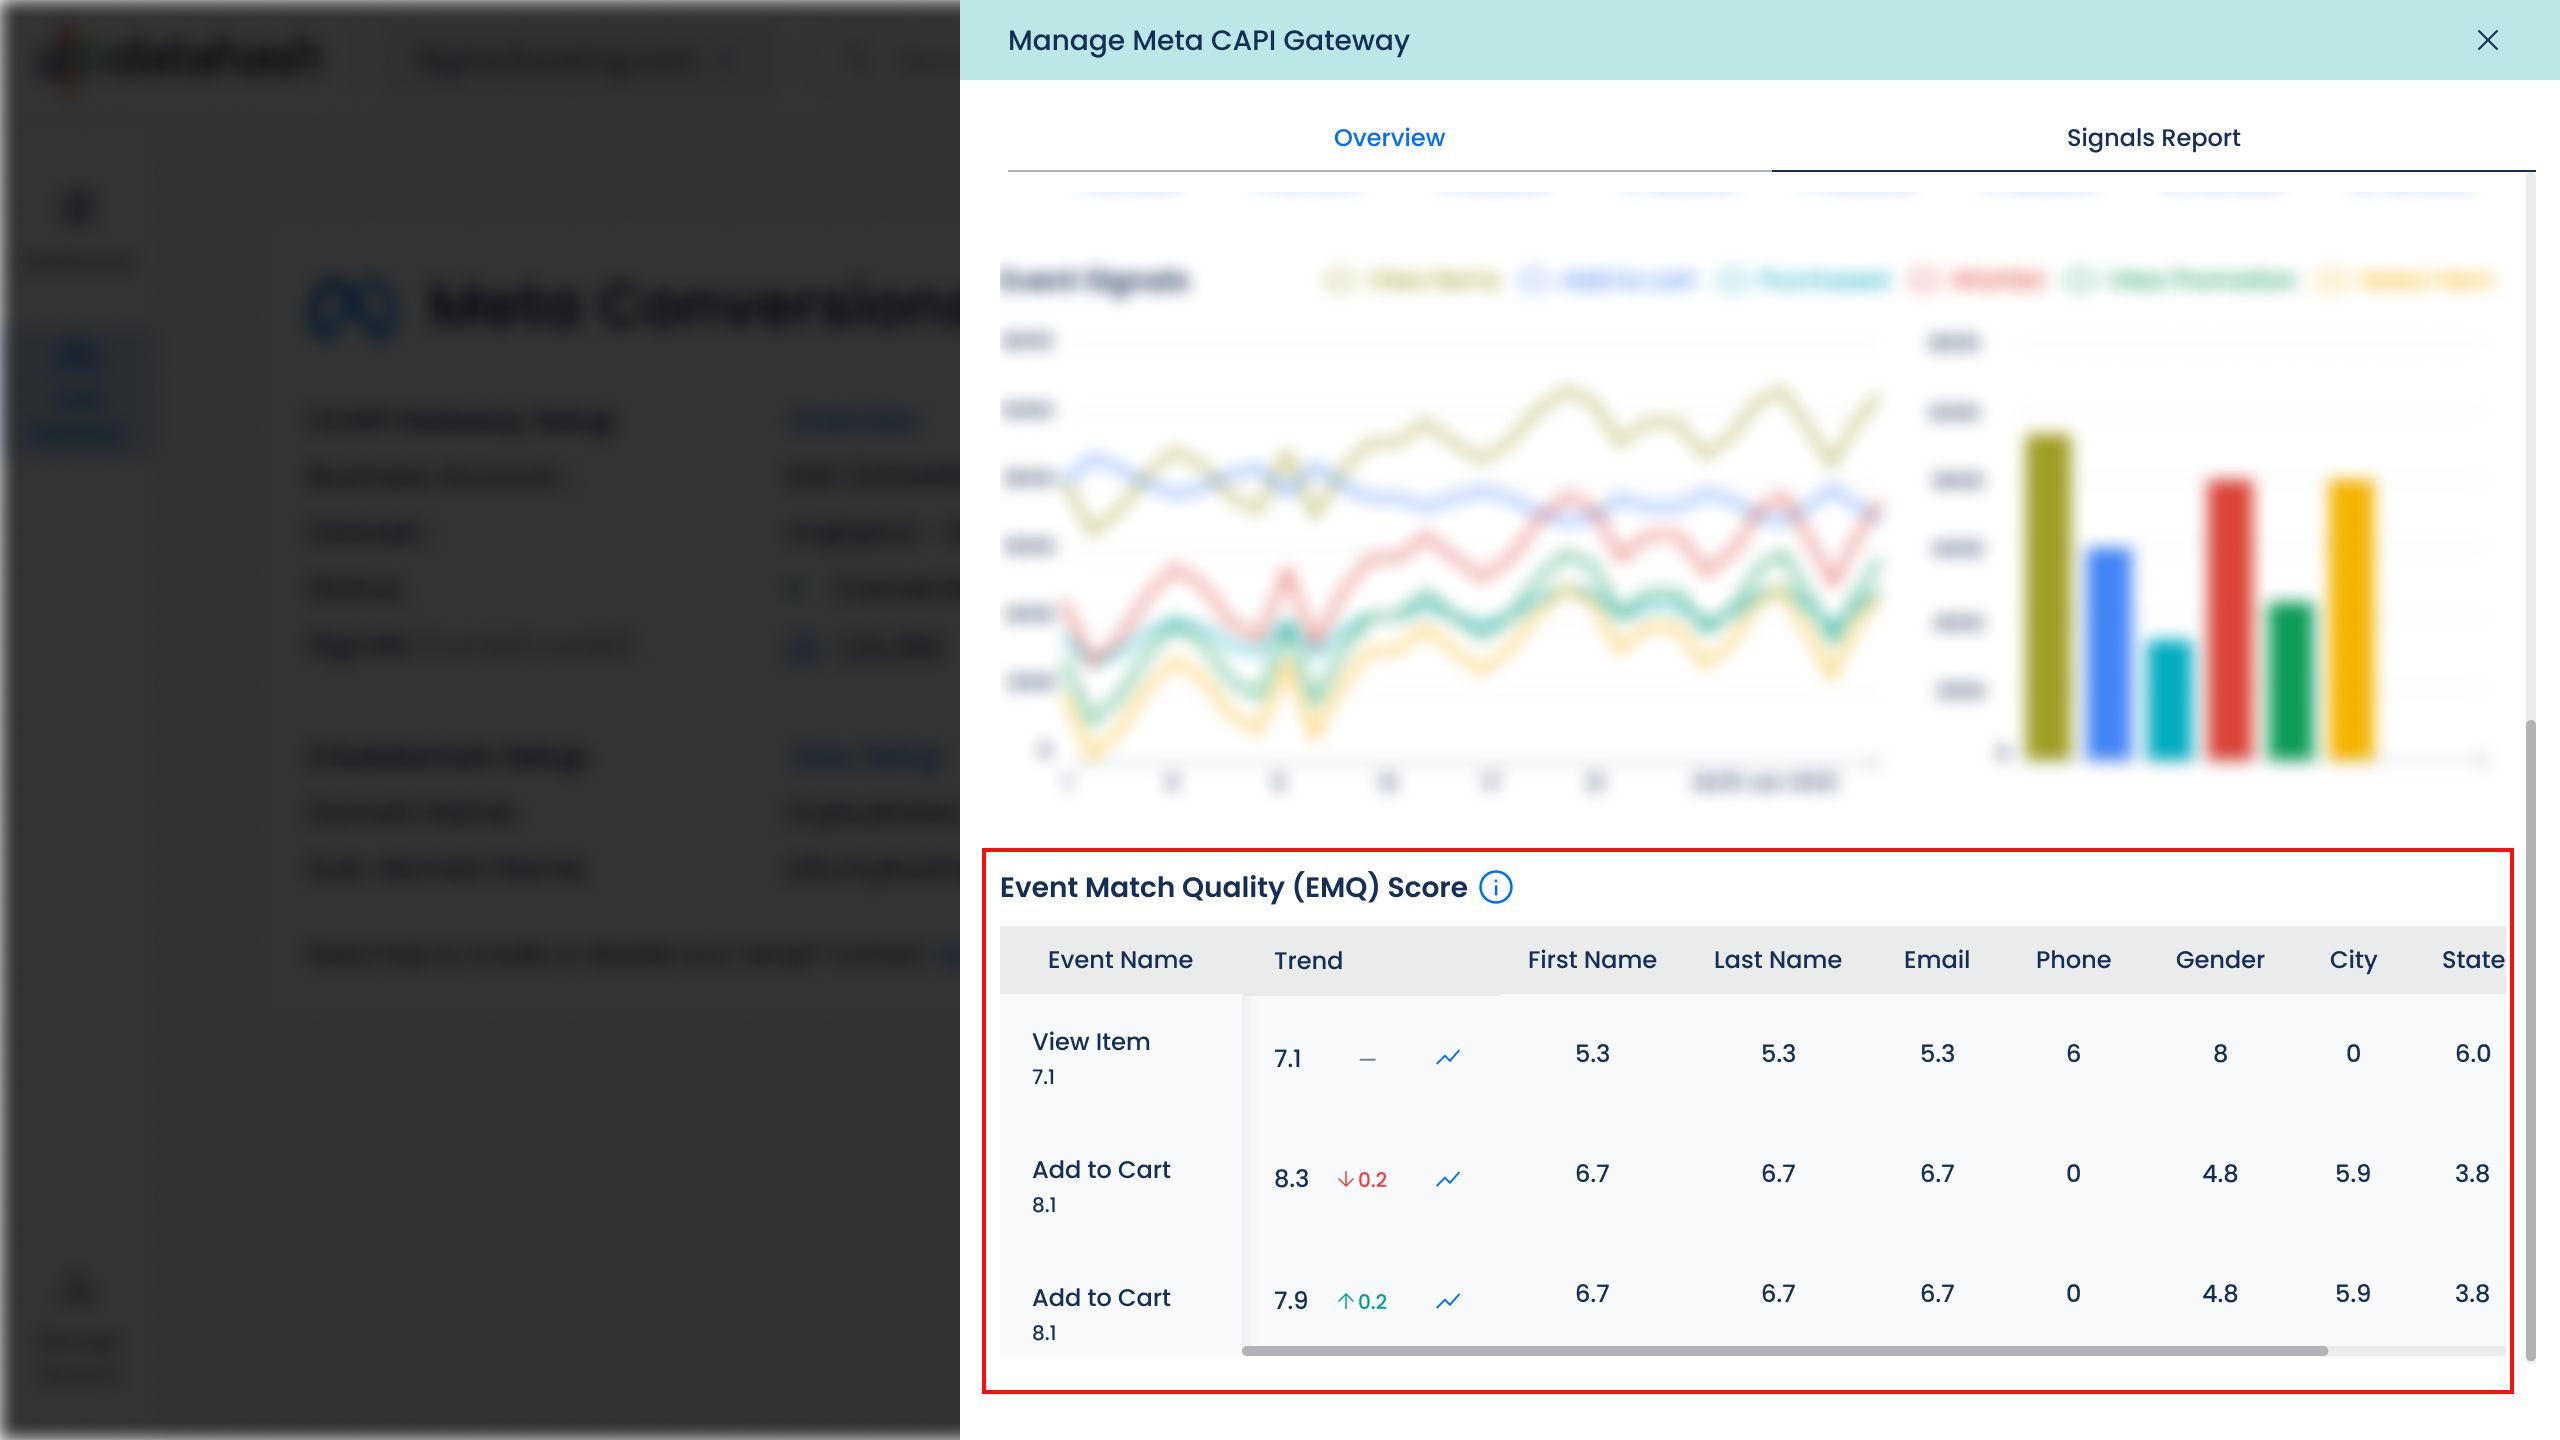
EMQ (Event Match Quality) Table
This table provides insights into the quality of data tracked based on the Event Match Quality (EMQ) score.
Key features:
- EMQ score for each event type
- Parameter coverage percentage
- Trend indicators (improving, stable, declining) including event graph for the selected date range
Interpreting Your Data
- Look for consistent patterns in your event volume
- Compare your Total Incoming Signals to Total Outgoing Signals to assess transmission efficiency
- Pay attention to events with low EMQ scores, as these may be limiting your advertising effectiveness
- Monitor how changes in your data collection or transmission processes impact your metrics


